|
::: Contacts »
|
::: SurfaceView :::
Software
package for the SPM-data processing, visualization and analysis
Acquisition of SPM-image of the sample surface is only first stage of its study. Next important task for researcher is correct interpretation of the recieved data. DESCRIPTION
 SurfaceView — is a 32-bit Windows-based program for visualization, processing and analysis of scanning probe microscopy data. SurfaceView utilizes an OpenGL technology for image presentation and manipulation that provides convenient and user-friendly on-line control over the visualization parameters. SurfaceView can include external plug-ins that provides flexible switching of specialised functions for SPM image processing. SurfaceView is developed by reserachers experienced in SPM operation, SPM data interpretation and analysis. It means that user receives a balanced set of functions really important to understand the results obtained with the SPM. FEATURES
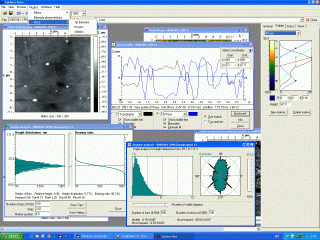
SurfaceView contains common set of functions usual for SPM data processing software (3D, 2D, 1D visualization, filtration, calculation of statistical parameters, sunlight simulation etc.) and includes advanced opportunities for the data presentation like flexible adjustment of the color palette, patterns of the surface drawing, on-the-fly zoom and rotation of a 3D image, etc. Plug-in linking option imparts to the program additional functionality. For example, plug-ins provide the image segmentation (grain analysis), SPM-image deconvolution with account of the tip shape, fractal dimension calculation, 3D modeling of the analyzed surface contact and some other specialized functions. Plug-ins also support operation with wide range of existing and newly developed file formats. Special feature of the SurfaceView software is an opportunity for direct joint analysis of SPM topography images and corresponding contrast images. In addition to their original function of the topography measurement, AFM's allow also mapping of lateral forces, phase shift, local electrical, magnetic and thermophysical properties as well as recording data of static and dynamic force spectroscopy. Analysis of distribution of the material properties over the surface and their comparison with the microgeometry helps to understand some intrinsic features of the materials and propose new ways in their improvement and reaching new preset performances. Joint 3D image (see Figure) can combine data of two types. One of them serves as a basic data set and it is rendered as a 3D SPM image. As a basic data set, different images can be chosen but topography image has among others a priority as it describes 'fundamental' characteristic spatial distribution of the material on the phase boundary within the scanned site. Secondary data set serves as a color table according to which points on the 3D image are colored. Contrast SPM images obtained simultaneously with the topography measurement are used as a secondary data set. So, the joint 3D image combines information from two data sets and directly visualizes distribution of specific characteristics over the scanned surface site. The figure shows that the joint analysis is especially useful at researching samples with heterogeneous properties, for example, composite materials. 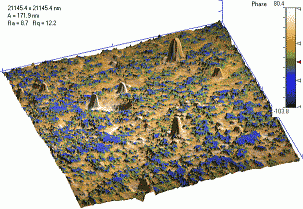 An example of joint analysis of topography and contrast images with the software package SurfaceView. Topography and phase shift map are rendered in joint 3D image. Surface of PZT ceramic doped with Ag particles. Blue color corresponds to Ag particles, yellow color corresponds to ceramic matrix. Silver is squeezed above the surface of ceramic matrix.
A unique function realized in the SurfaceView package is elimination of height artifacts caused by the non-uniform material deformation by the AFM tip at scanning in Tapping Mode. The function takes into account real Young’s moduli of the materials found in the sample (upprer Figure) and corrects on topography image the height of the points within the scanned matrix taking information on local stiffness distribution from the corresponding phase shift image. As a result, a matrix of calculated differences in heights (lower Figure, b) is built in addition to the corrected topography image. Cross section visualizing function includes a possibility to plot simultaneously two profiles relating to any images from the same SPM data set. Getting a profile from one image (for example, topography), the software traces similar profiles in all other data matrices existing in the SPM data set. That function provides more precise measurement and analysis of considered features on the image including comparison of the properties different from topography data. Figure shows an example where profile from topography image is plotted with the corresponding profile from the phase contrast image. Note that some risen sites are softer than material in valleys.
EXAMPLES
|


